

/
The whole graded stablecoin universe on one page: five discrete grade bands: A at the centre, then B, C, D, and F outward; orbit = grade band, not a continuous score; bubble area tracks circulating supply above a per-tier minimum marker; assets below their tier's threshold share a fixed presence marker.
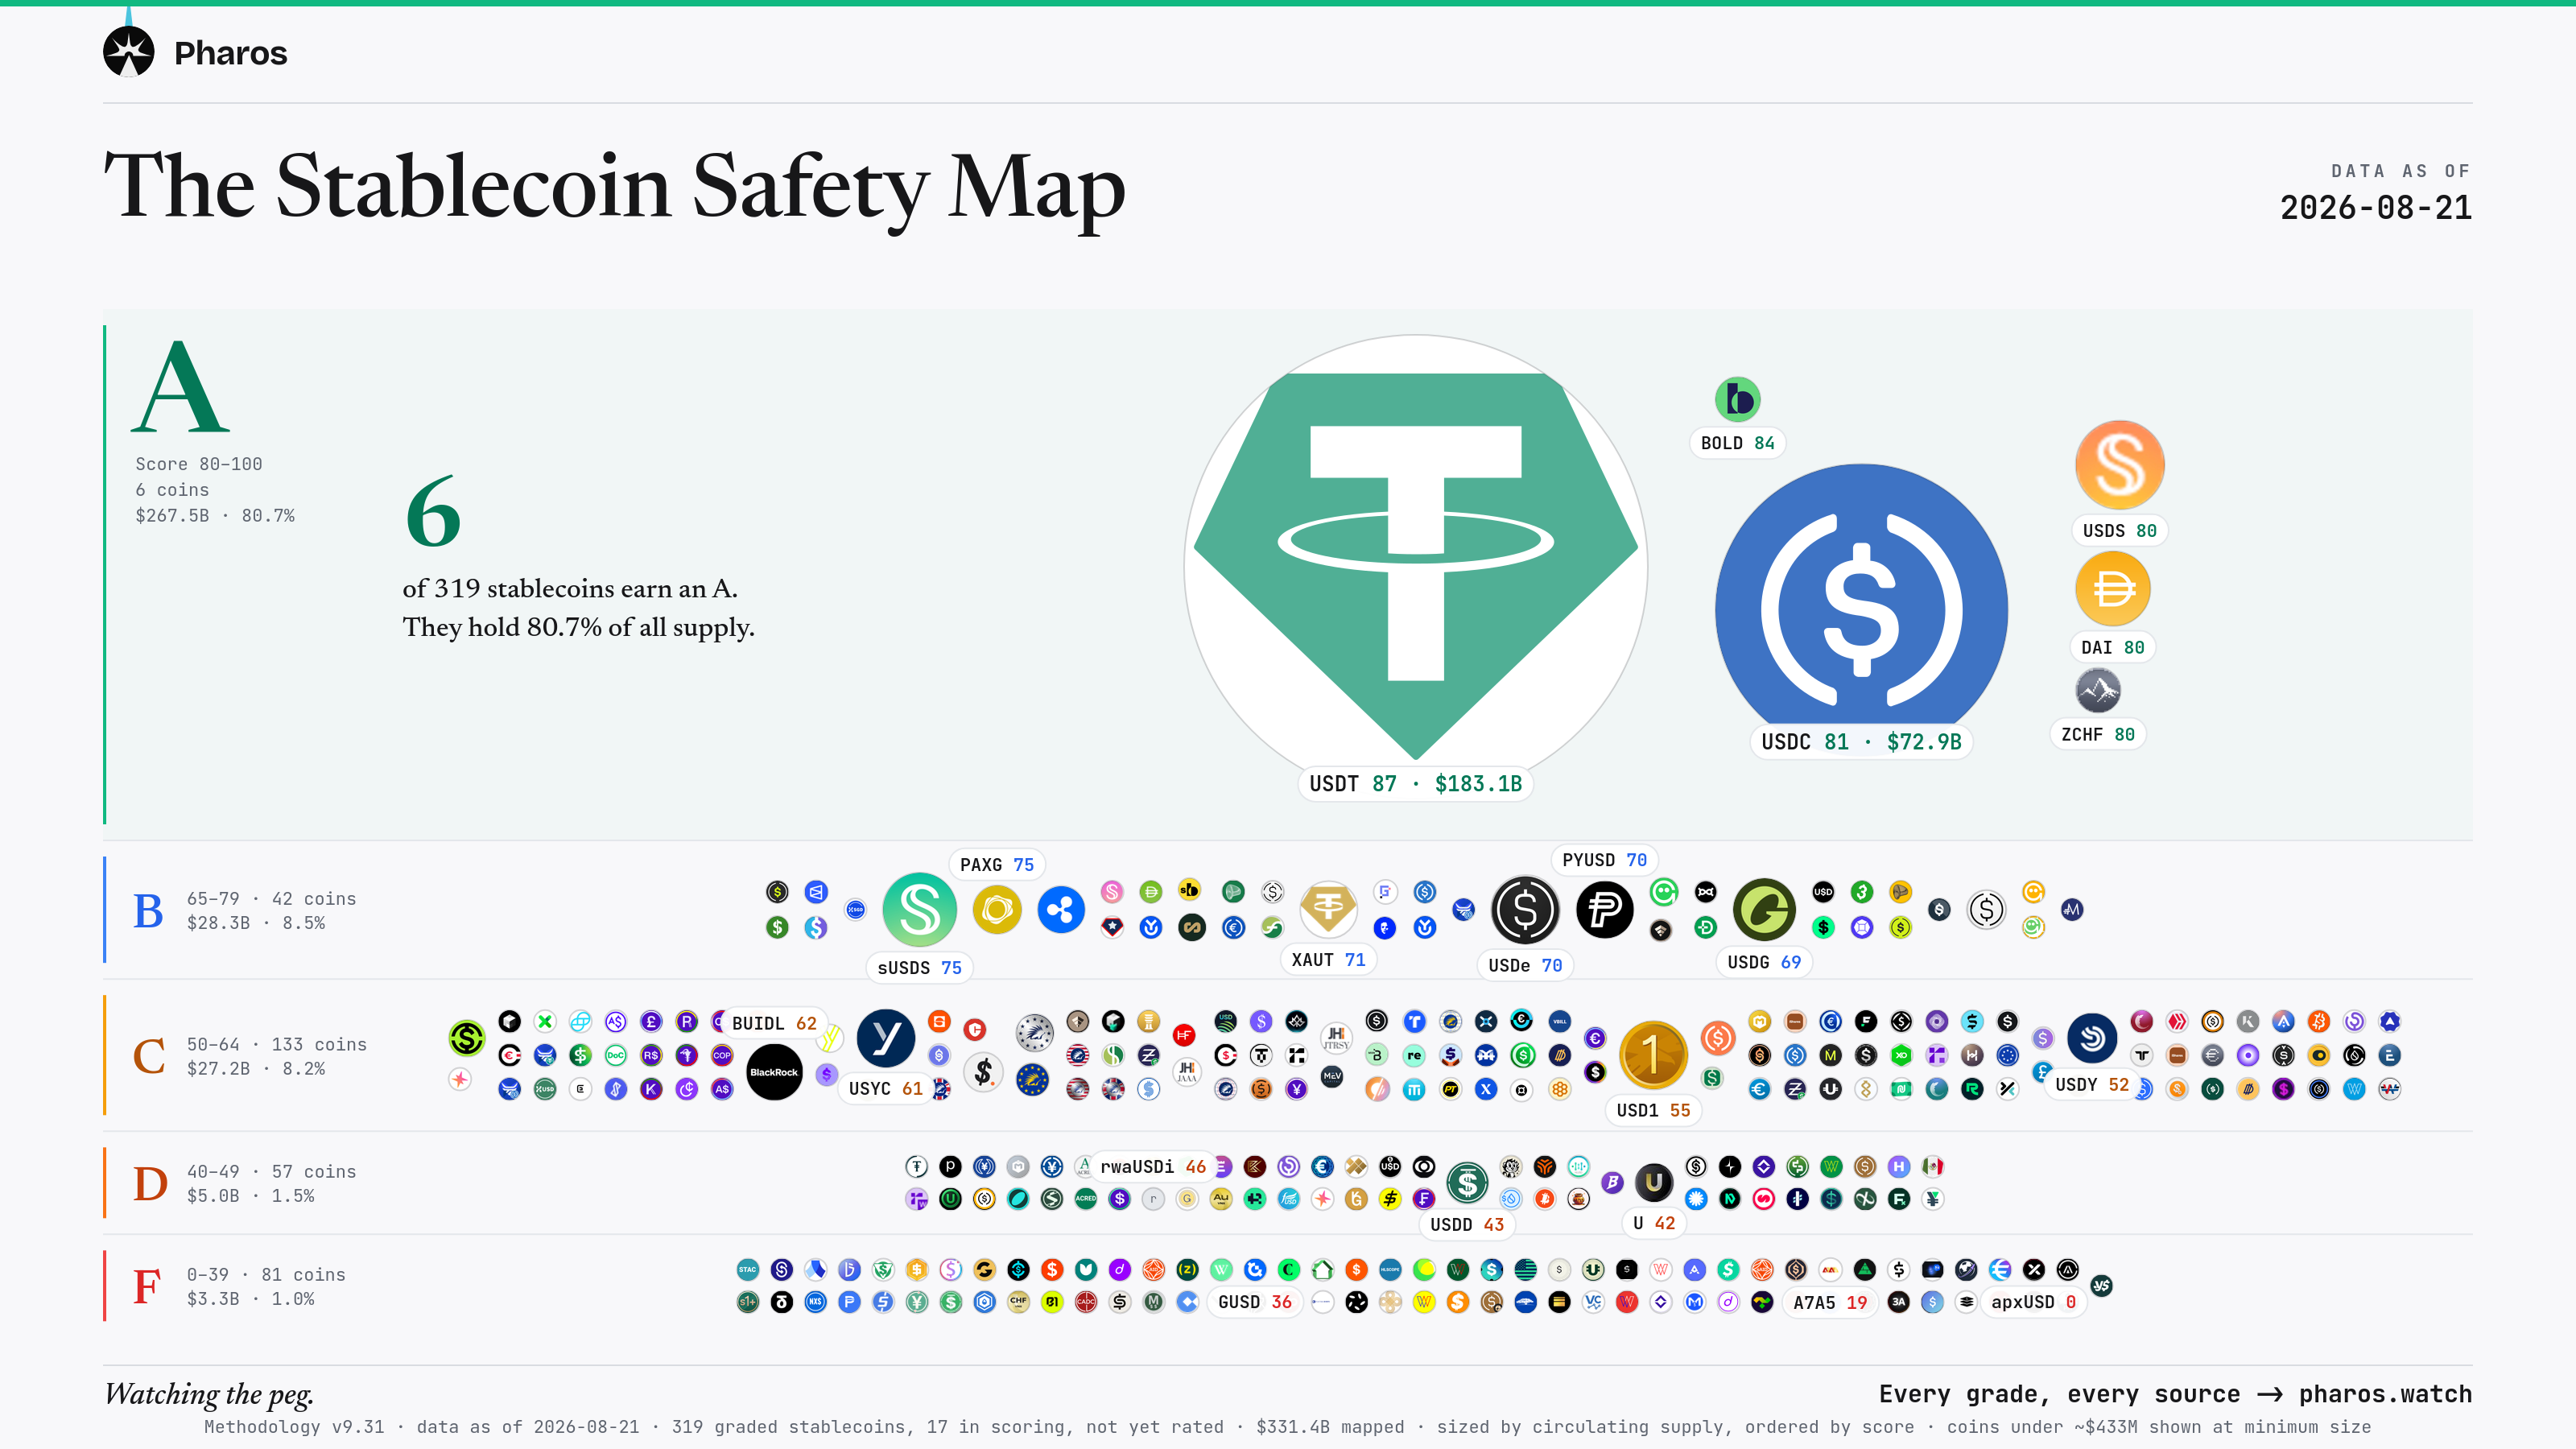
Pipeline gap assets have no score or grade and are not placed in A–F bands. Rated partial cards remain mapped; see “Partial evidence: pipeline gap” and the pipeline unavailable (A) or public data awaiting curation (B) reason on the Safety Scores page.
Download the poster (PNG, 3200 × 1800)The poster is rebuilt and republished every day from the same Safety Score data the rest of the site reads, so the copy above is always the current census rather than a hand-updated snapshot. The date it was rendered from is stamped into the image footer — trust that stamp over the day you happen to be looking at it, and re-download rather than reusing an old file when the date matters.
A map is a summary. It shows where a coin landed, never why. For the pillar-by-pillar reasoning behind a grade — backing, exit, economic control, evidence quality, and any binding cap — open the coin on the Safety Scores page, which is also the accessible, sortable form of everything drawn here.
The poster is free to republish, share, and print. Keep the footer intact so the methodology version and the data-as-of date travel with the image, and credit Pharos.